An expense ratio is the percentage of a fund’s average net assets used each year to pay its operating expenses. At 0.20%, that is about 20 a year for a holding whose average value stays at 10,000. The expenses reduce the fund’s value; you do not normally receive a separate invoice.
Over time, the cost is more than the deductions alone: money removed by fees cannot earn future returns. To compare two funds, examine that effect alongside their holdings, trading costs and tax treatment.
Compare two fee levels: use the Investment Fee Calculator with the same starting balance, contributions, horizon and gross return to isolate the modeled fee effect.
What the expense ratio includes
Investor.gov’s definition covers operating expenses such as management, distribution or service fees, acquired-fund fees and other fund expenses. Check the product’s prospectus or key information document for its own charge labels and scope.
The expense ratio is not necessarily the total cost to you. Brokerage commissions, bid-ask spreads, platform charges, advice fees, taxes and some fund transaction costs can sit outside that headline figure. Investor.gov separates annual operating expenses from shareholder fees; the distinction helps you avoid comparing incomplete cost figures.
Worked example: 0.20% vs 1.00% annual fee
Consider two hypothetical portfolios. Each starts with 20,000, receives 500 at the beginning of every month and earns the same constant 7% gross annual return. One has a 0.20% annual balance fee; the other has a 1.00% fee. All values use one currency unit. Taxes, trading costs and inflation are excluded.
| Horizon | 0% fee benchmark | 0.20% fee | 1.00% fee | Difference between 0.20% and 1.00% |
|---|---|---|---|---|
| 10 years | 125,352 | 123,615 | 116,916 | 6,699 |
| 20 years | 332,597 | 323,401 | 289,335 | 34,066 |
| 30 years | 740,278 | 708,621 | 596,079 | 112,543 |
| 40 years | 1,542,247 | 1,451,387 | 1,141,792 | 309,595 |
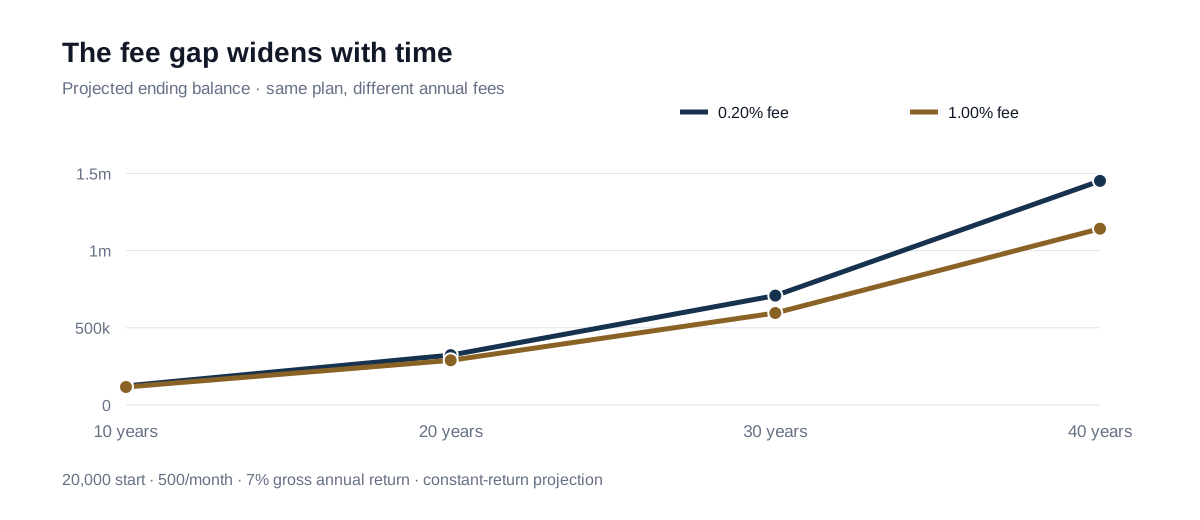
After 30 years, the lower-fee projection ends about 112,543 ahead. That is the difference between the unrounded balances; subtracting the displayed rounded figures gives 112,542. Calculations retain full precision before rounding.
The model holds gross returns equal to show the fee mechanism. These are not historical results or forecasts, and different real funds may have different holdings and returns. Later monthly contributions also have less time to compound than the starting balance, so the fee effect depends on the contribution schedule as well as the fee and horizon.
How the calculator applies fees
The model combines the annual gross-return factor and fee factor multiplicatively:
Net annual growth factor = (1 + gross annual return) × (1 − annual fee)
For a 7% gross return and a 1% fee, (1 + 7%) × (1 − 1%) = 1.0593. That is a modeled net annual growth factor of 1.0593, equivalent to a 5.93% annual return. Simply subtracting the fee from the return would give 6%, which is not the convention used here.
The annual factor is converted to an equivalent monthly factor. Contributions enter at the start of each month, before growth. This is a projection convention, not a claim about the deduction schedule or accounting treatment of every real fund.
Fee drag is not the same as fees paid
Ending-value drag is the gap between a fee-bearing projection and the same model with no annual fee. In the 30-year example, that gap is about 31,656 for the 0.20% fee and 144,199 for the 1.00% fee, calculated before rounding the balances.
Those figures include both the fee effect and the growth that the deducted amounts no longer earn. They are not a statement of amounts invoiced or direct fees paid. See fee drag vs fees paid for that separate comparison.
Compare similar investments before comparing fees
A cheaper fee does not make two different investments interchangeable. Before using a fee comparison to choose between actual products, check:
- Exposure: their benchmark, holdings and diversification.
- Structure: currency hedging, income distributions and replication method where relevant.
- Implementation: tracking difference, liquidity and bid-ask spreads.
- Your costs: broker, platform, currency-conversion and tax treatment for the account and jurisdiction.
A higher-cost fund can outperform a lower-cost one, and a low-cost fund can lose money. The calculator deliberately holds gross return constant to isolate one cost; it does not rank real products or determine suitability.
Put the fee difference in context
Use the same balance, contribution schedule, horizon and gross-return assumption for both calculator scenarios. Compare ending values and the no-fee benchmark, then return to the actual products and include the costs omitted from the model.
For named accumulating share classes, the selected S&P 500 UCITS ETF fee comparison shows why a small annual charge saving can be outweighed by broker or switching costs. Its charge ranking is not an overall investment recommendation.
Sources and methodology
The table is an original Finance Charts projection using the documented calculation conventions. Source concepts checked on 26 October 2026:
- Investor.gov — Expense Ratio: definition and operating-expense categories.
- Investor.gov — Mutual Fund and ETF Fees and Expenses: annual operating expenses versus shareholder charges.
- Investor.gov — How Fees and Expenses Affect Your Investment Portfolio: why ongoing costs affect long-term outcomes.
- FINRA — Mutual Funds: fund costs and additional investor charges in a US context.
These sources support the concepts, not the selected 7% return assumption or future performance. Product charges, account rules and taxes vary by provider and jurisdiction. The examples are educational scenarios, not personalised investment advice.
How this revision was prepared
This revision was edited with AI assistance. Its displayed examples were checked with a separate high-precision calculation, and the cited source concepts were checked on 26 October 2026. These are calculation and source checks, not an independent professional financial review. See the editorial policy or report a correction.